Session-Level Forensics
My Claude discovers and displays your Claude Code sessions, giving you a searchable history with deep analytics. Click into any session and see exactly where your tokens went - turn by turn.
Session Browser
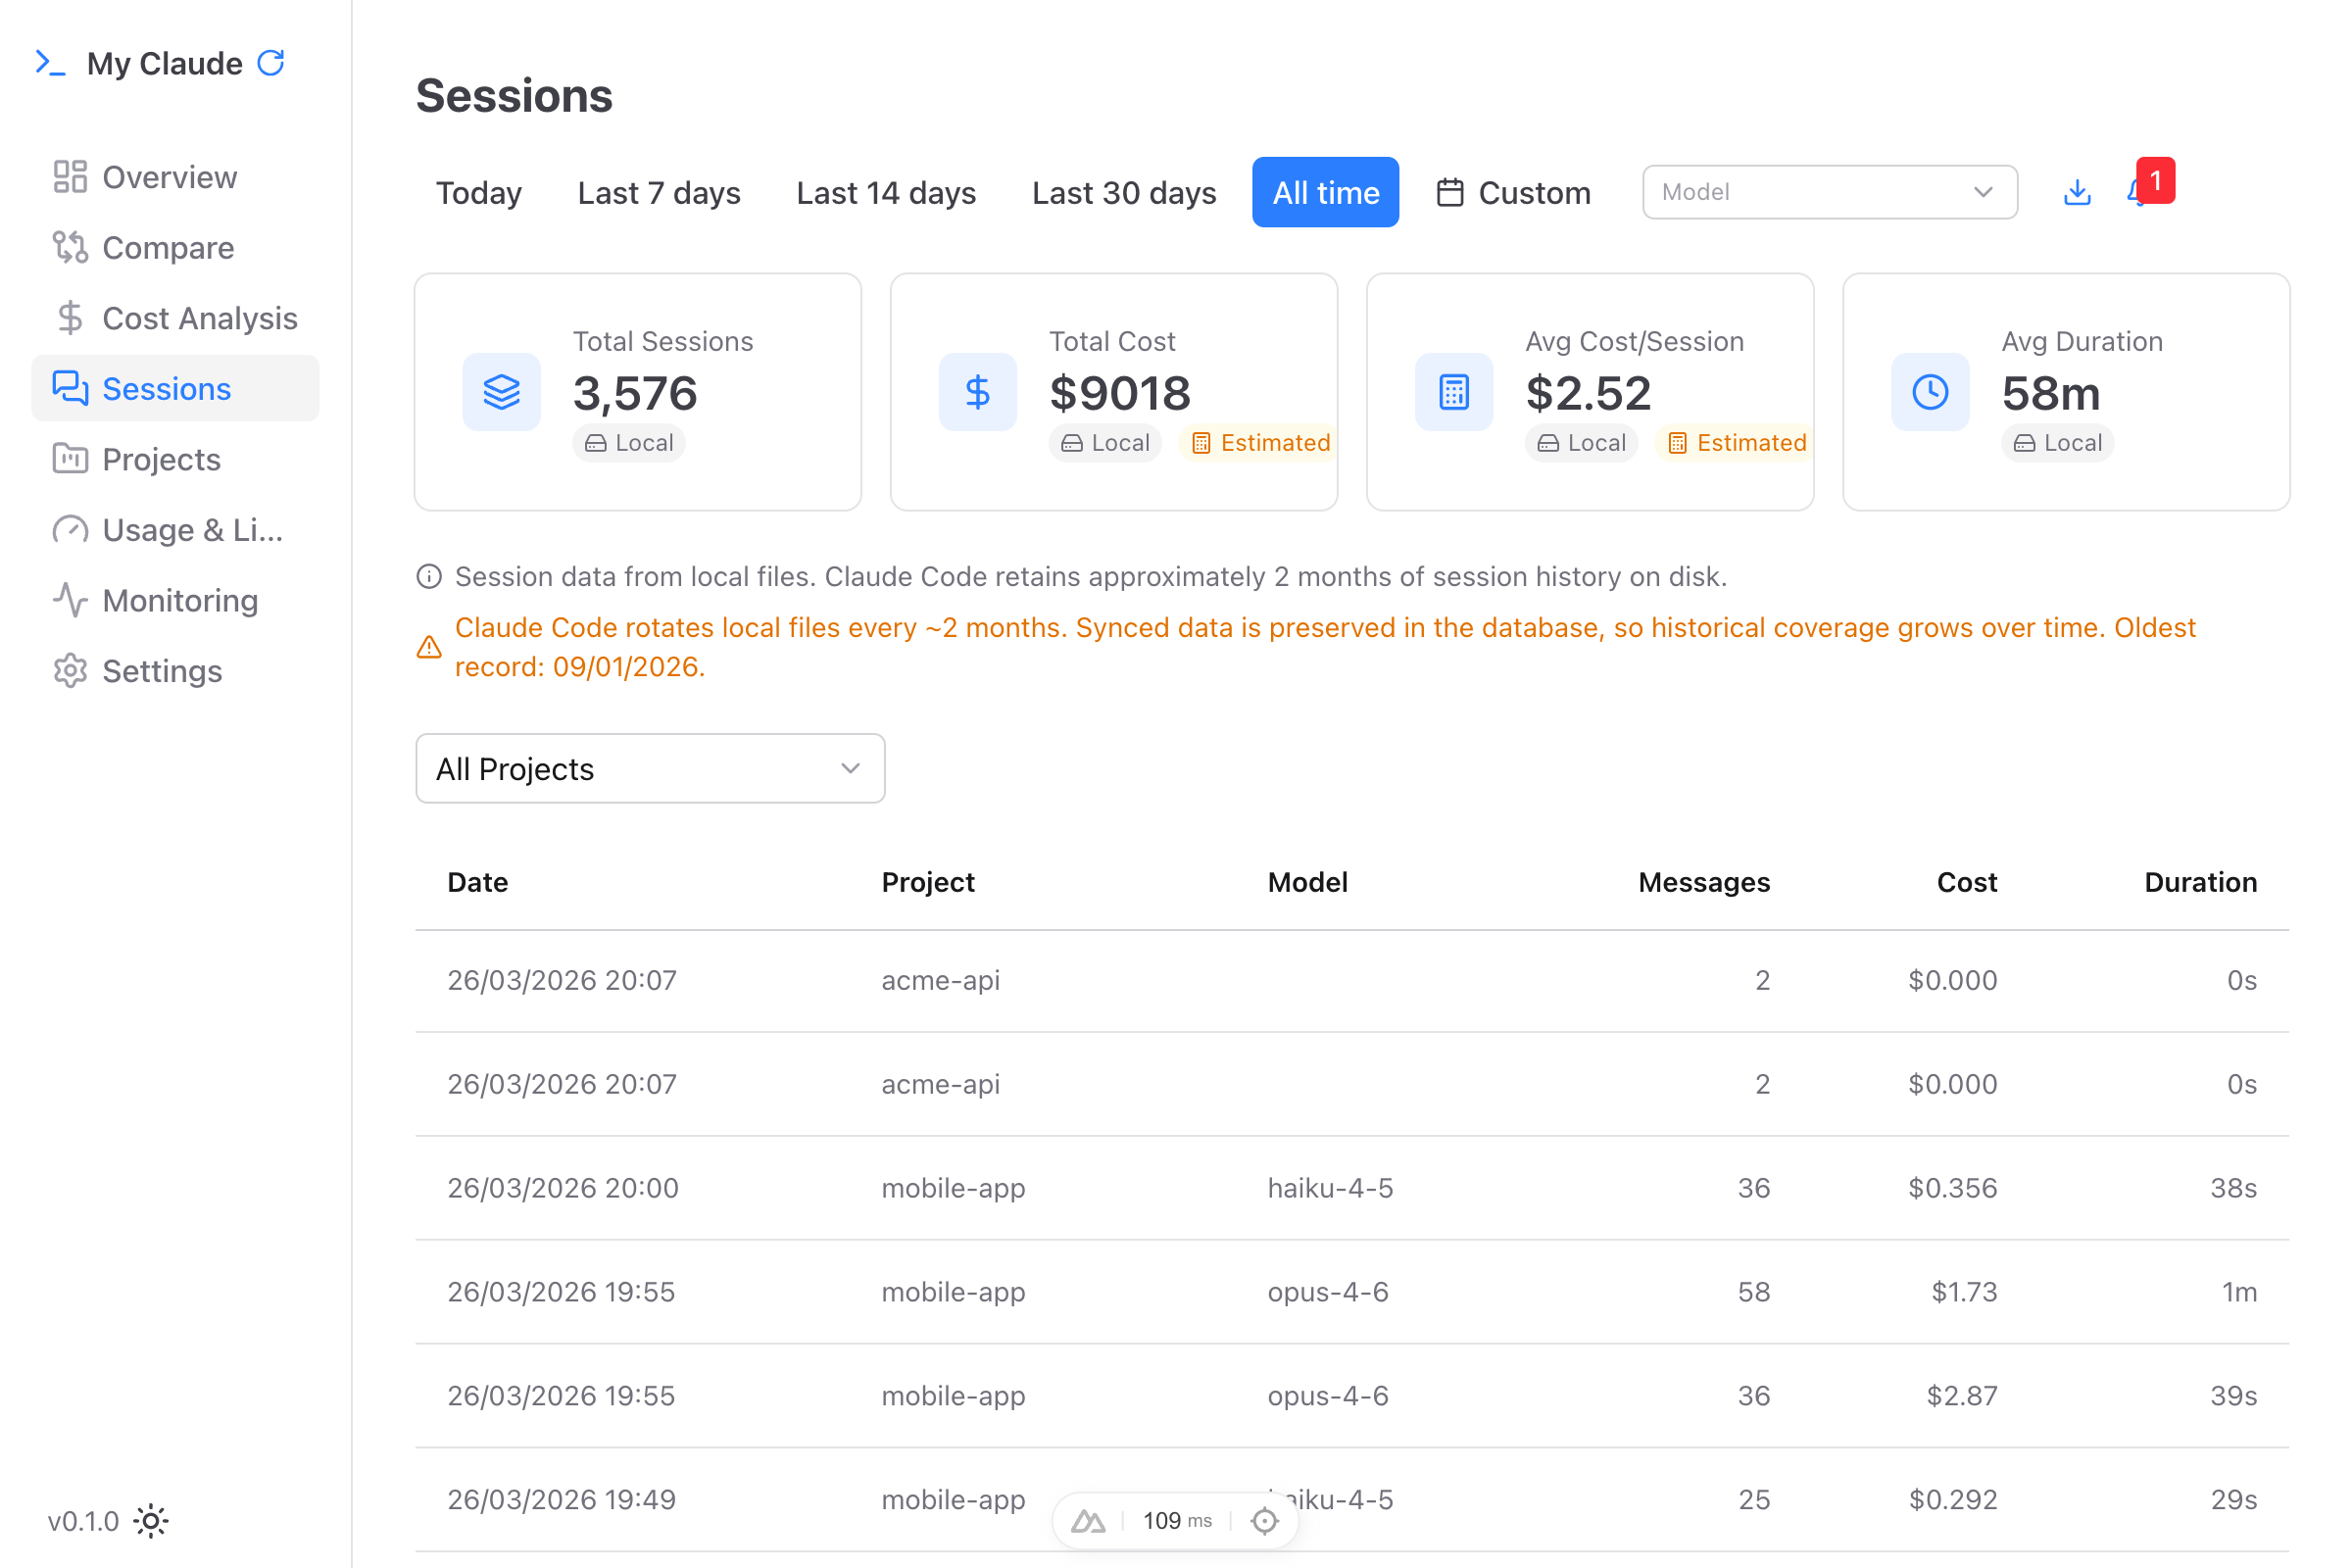
The Sessions page shows a paginated list of all your Claude Code sessions with:
- Date and time - When the session started
- Project name - Which project the session belongs to (filterable)
- Model used - Which Claude model was active (Sonnet, Opus, Haiku)
- Message count - Total messages in the session
- Total cost - Estimated cost in dollars
- Duration - How long the session lasted
Click any row to drill into the full session detail.
Session Detail View
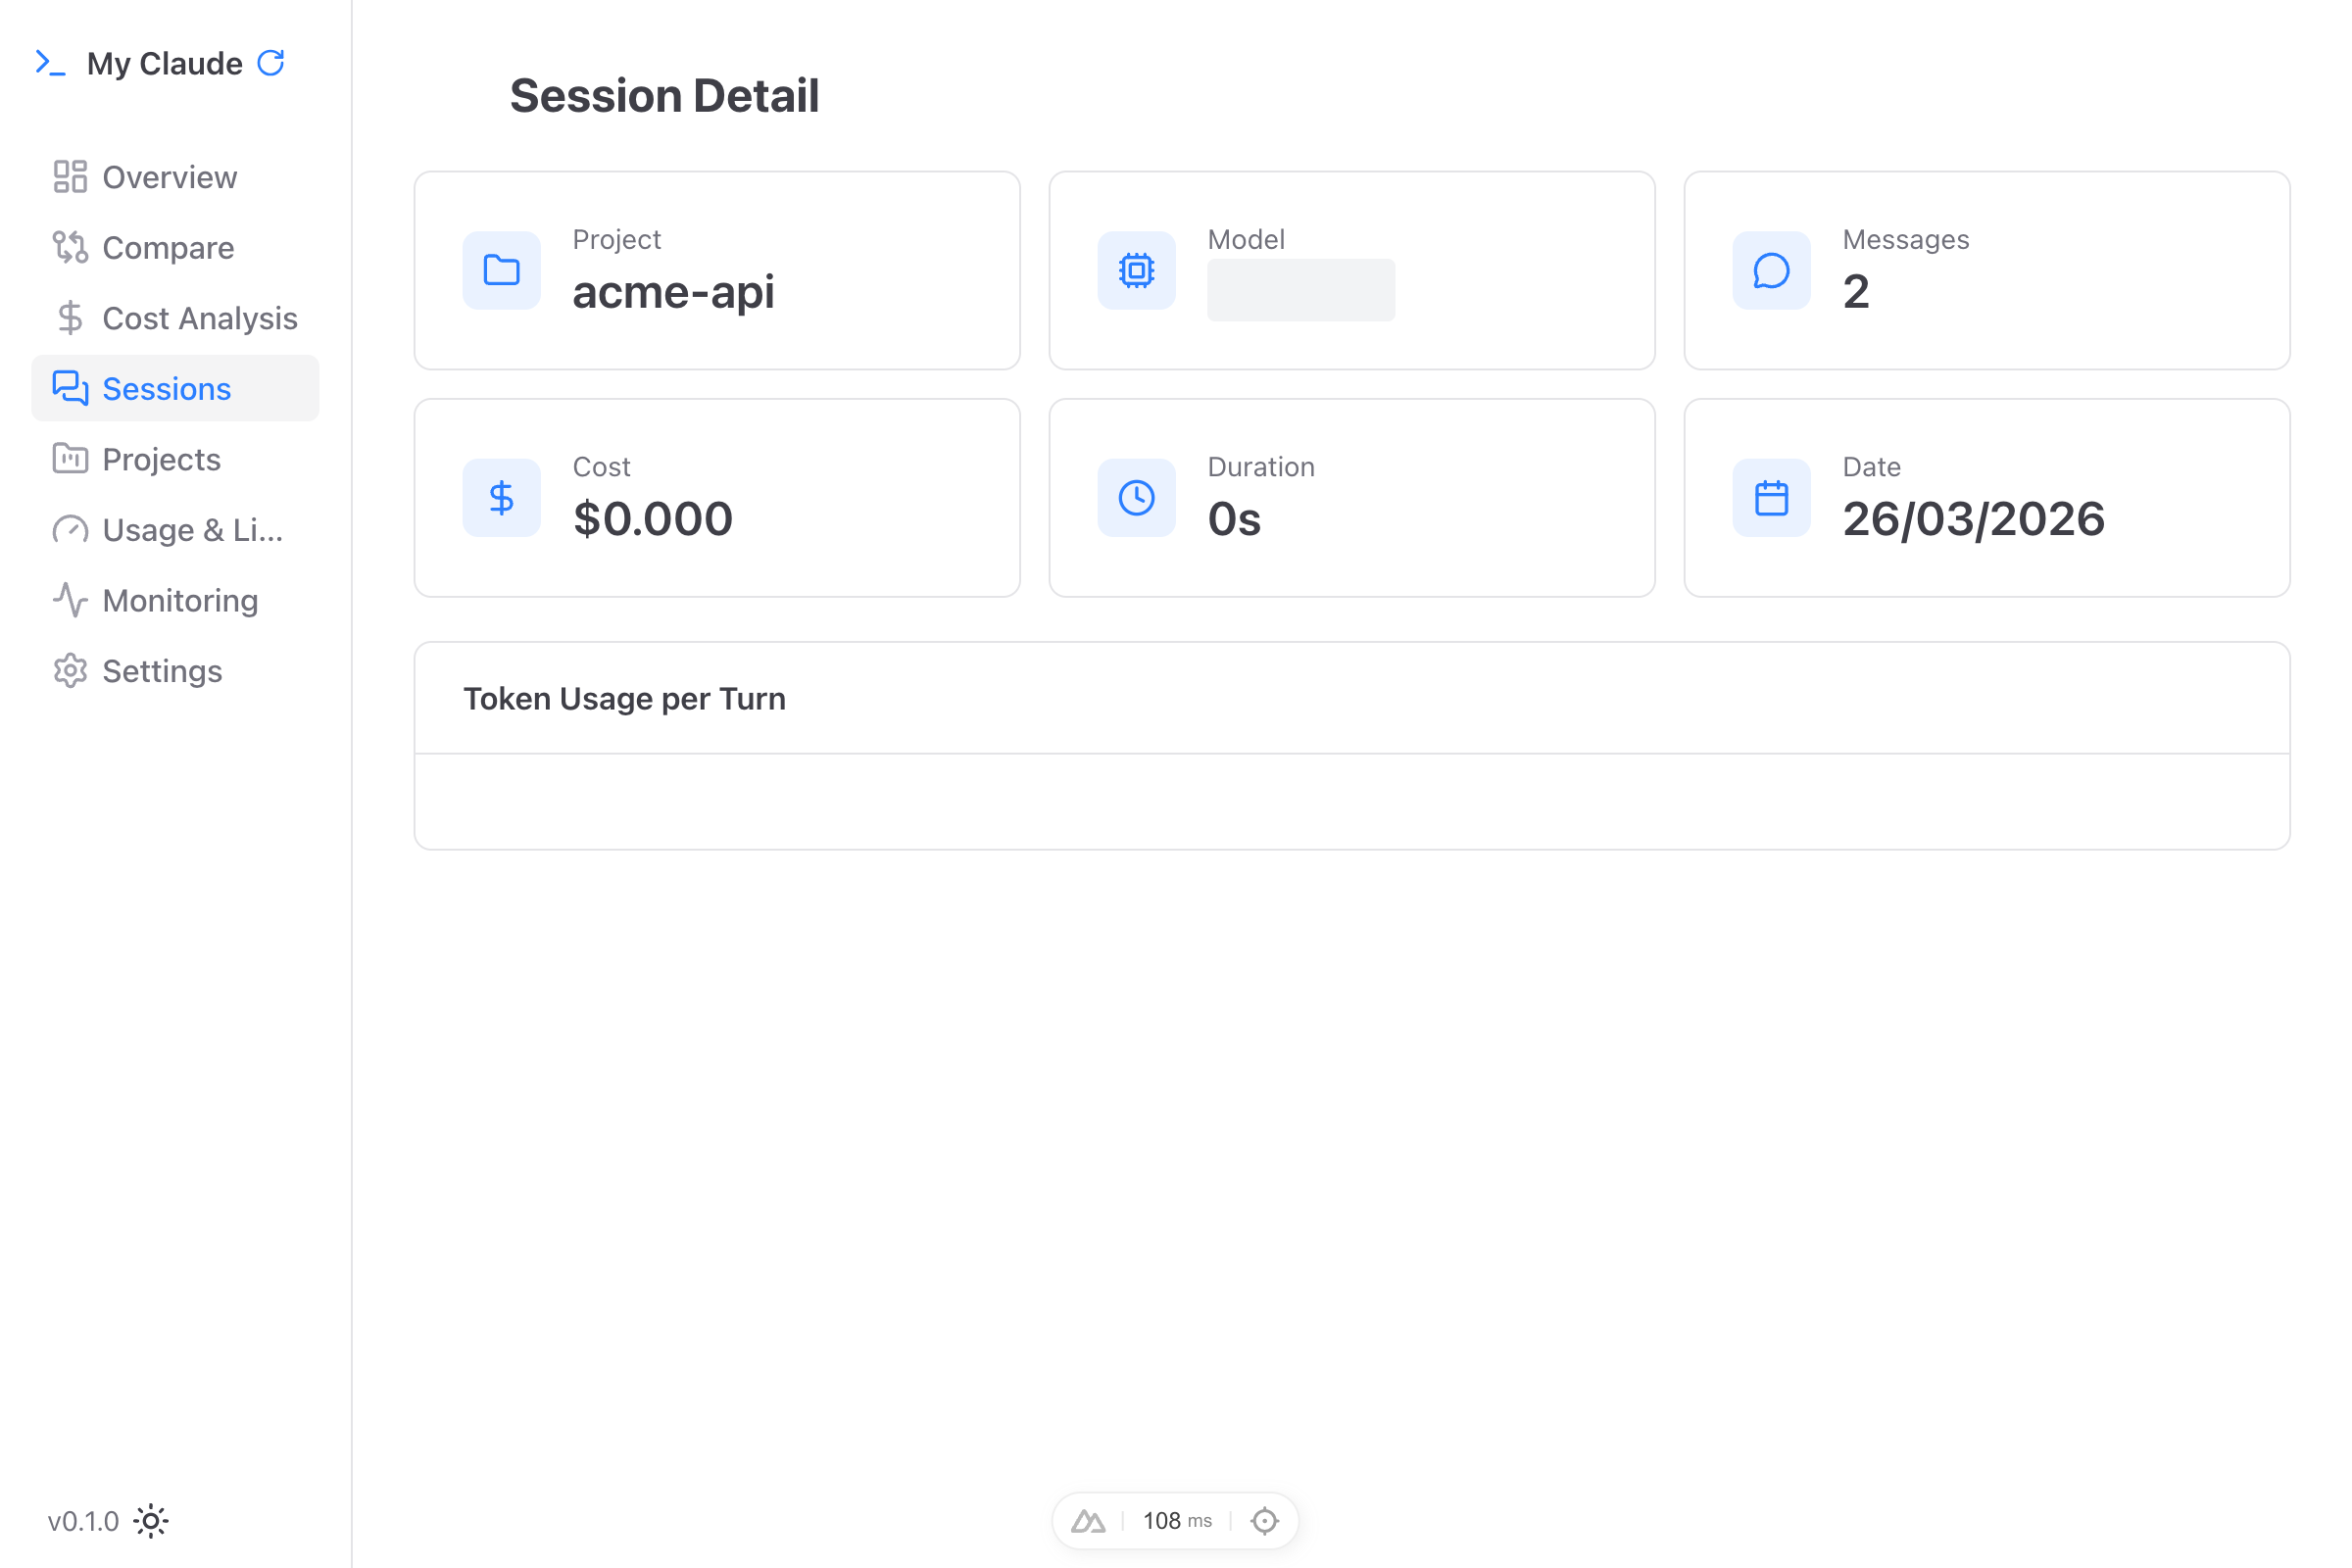
Each session detail page shows six KPI cards at the top: Project, Model, Messages, Cost, Duration, and Date. Below that, a turn-by-turn breakdown table.
Per-Turn Token Breakdown
Every assistant message is listed with:
- Model - Badged with the specific model used for that turn
- Timestamp - Exact time of the response
- Input tokens (blue) - Tokens sent to Claude
- Output tokens (purple) - Tokens Claude generated
- Cache read tokens (green) - Tokens served from prompt cache (effectively free)
- Cache write tokens (amber) - Tokens written to cache for future reuse
- Cost - Dollar cost for that specific turn
The color coding makes it immediately obvious which turns hit the cache and which didn't. You can see exactly where caching saved you money in the conversation flow.
Tool Call Tracking
See how many tool calls were made during each session. This helps you understand which sessions are tool-heavy (and therefore more expensive) versus pure conversation.
Browsing and Filtering
- Search - Filter sessions by keyword to find specific conversations
- Filter by project - View sessions for a specific project only
- Sort - Order sessions by date or project
- Pagination - 25 sessions per page with navigation
Per-Project Tracking
Sessions are grouped by project, so you can see:
- Total sessions per project
- Total cost per project
- Average cost per session
- Activity patterns across different codebases
- Which projects drive the most Claude Code usage
This is useful for teams or individuals working across multiple repositories who want to understand where their allocation is concentrated.
Context Window Analysis
See how your context window is being consumed:
- Model name and total context window size
- Used tokens vs available tokens
- Breakdown by category (system prompt, memory, conversation, instructions)
- Free space remaining
- Autocompact buffer allocation
This helps you understand why certain sessions run out of context faster than others.
Session Discovery
My Claude reads session data from your Claude Code installation automatically - there is no manual import step. Sessions are discovered and indexed on first sync, then kept up to date.
Export
Export session data in CSV or JSON format for external analysis or record-keeping. Use the export button on the Sessions page to download your filtered session history.