
Real-Time Dashboard & Cost Analytics
My Claude gives you a live dashboard that shows exactly where your Claude Code usage stands - not after the fact, but right now. Utilization gauges, burn rate, cost breakdowns, and pace predictions all in one view.
Dashboard Overview
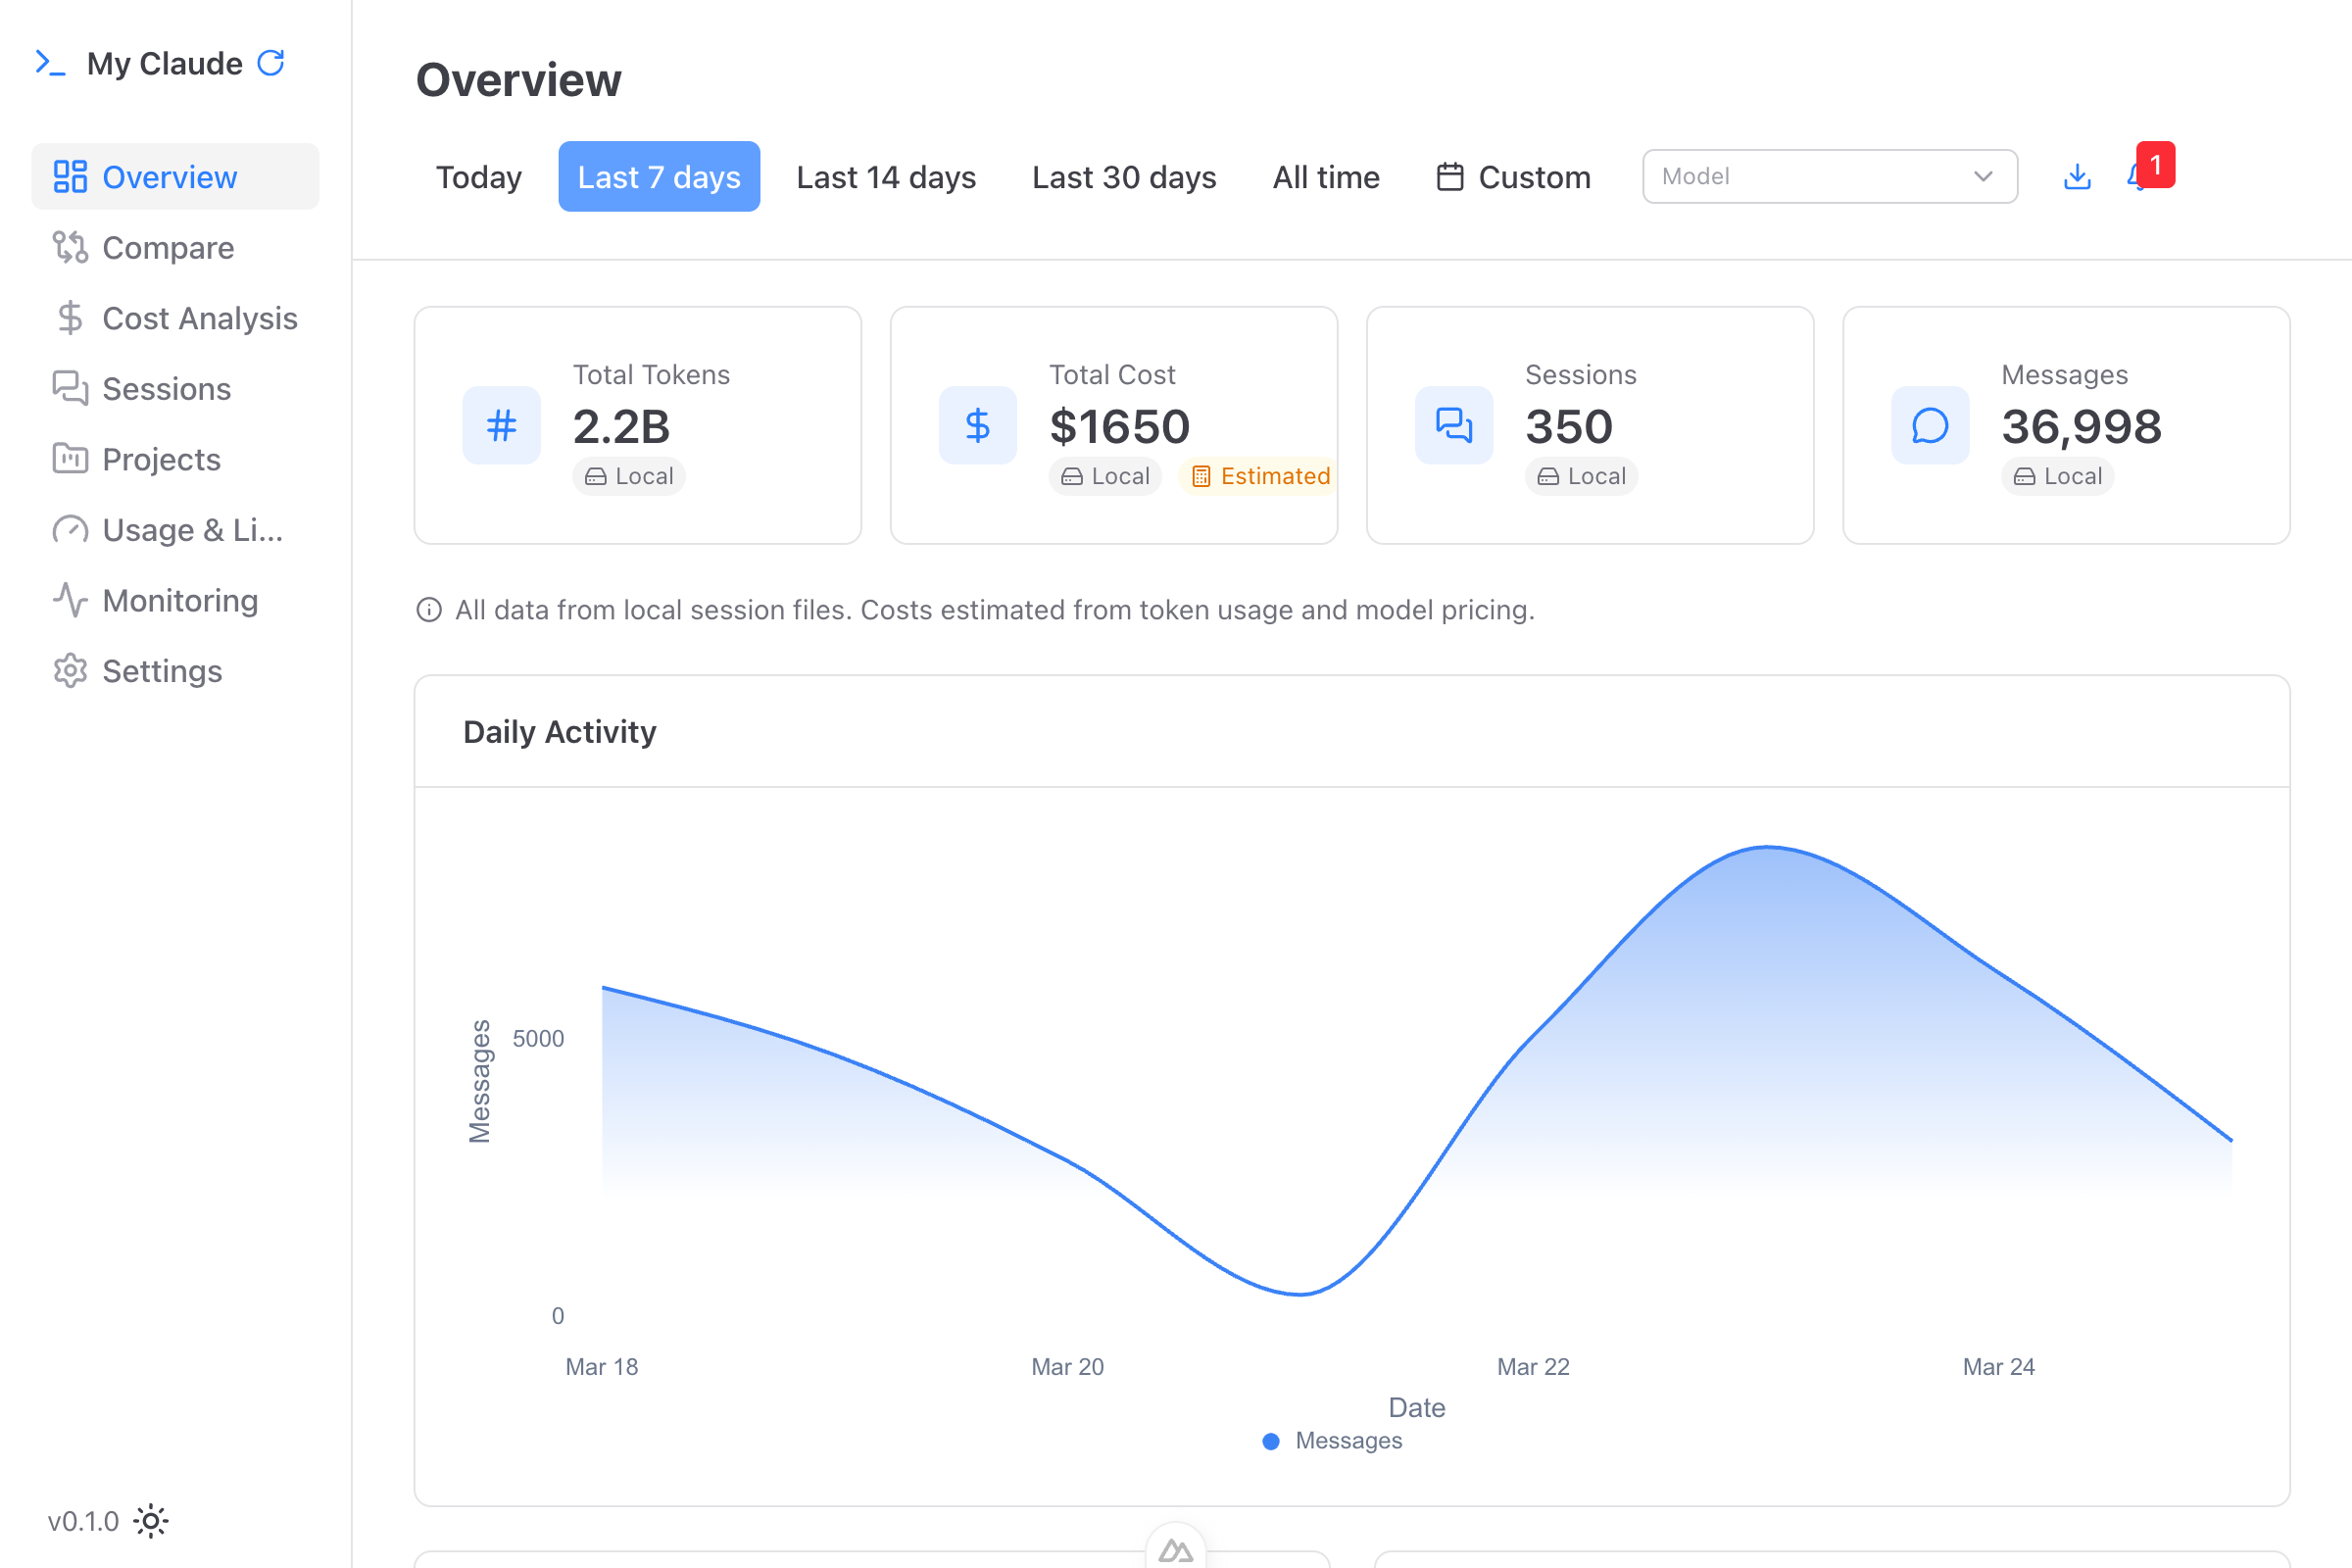
The main dashboard displays:
- 5-Hour Window Gauge - Your current utilization in the rolling 5-hour window, color-coded green/yellow/red
- 7-Day Window Gauge - Your utilization in the rolling 7-day allocation
- 7-Day Sonnet Window - Separate gauge for Sonnet-specific rate limits
- Total Cost - Estimated or API-synced costs for the selected period
- Total Sessions - Number of Claude Code sessions
- Total Messages - Message count across all sessions
Burn Rate
My Claude calculates your current burn rate in real-time:
- Tokens per hour - How fast you're consuming tokens
- Cost per hour - What your current pace is costing you
- Messages per hour - Your interaction velocity
This tells you at a glance whether your current work pace is sustainable or if you need to slow down.
Pace Predictions
The pace system projects your usage forward and tells you exactly when you'll hit your limit:
- On Track (green) - Current usage rate is sustainable, you'll reset before exhaustion
- Warning (yellow) - You may hit the limit if you continue at this rate
- Critical (red) - You will hit the limit before the window resets, with the exact predicted time
Instead of a vague "you're at 73%", you see "You'll hit your cap at 3:15pm." That's the difference between a surprise lockout and a deliberate decision to pace yourself.
Charts and Analytics
Activity Heatmap
A hour-by-hour heatmap showing your usage intensity across the day. Immediately see your peak coding hours and when you tend to burn through tokens the fastest.
Daily Activity Chart
Area chart showing messages and tokens over time with dual-axis visualization. Track trends across days and weeks.
Model Cost Breakdown
Stacked bar chart breaking down costs by model (Opus, Sonnet, Haiku) and token type:
- Input tokens (blue) - What you sent to Claude
- Output tokens (purple) - What Claude generated
- Cache read tokens (green) - Free tokens from prompt caching
- Cache write tokens (amber) - Initial cache population cost
Cache Savings Visualization
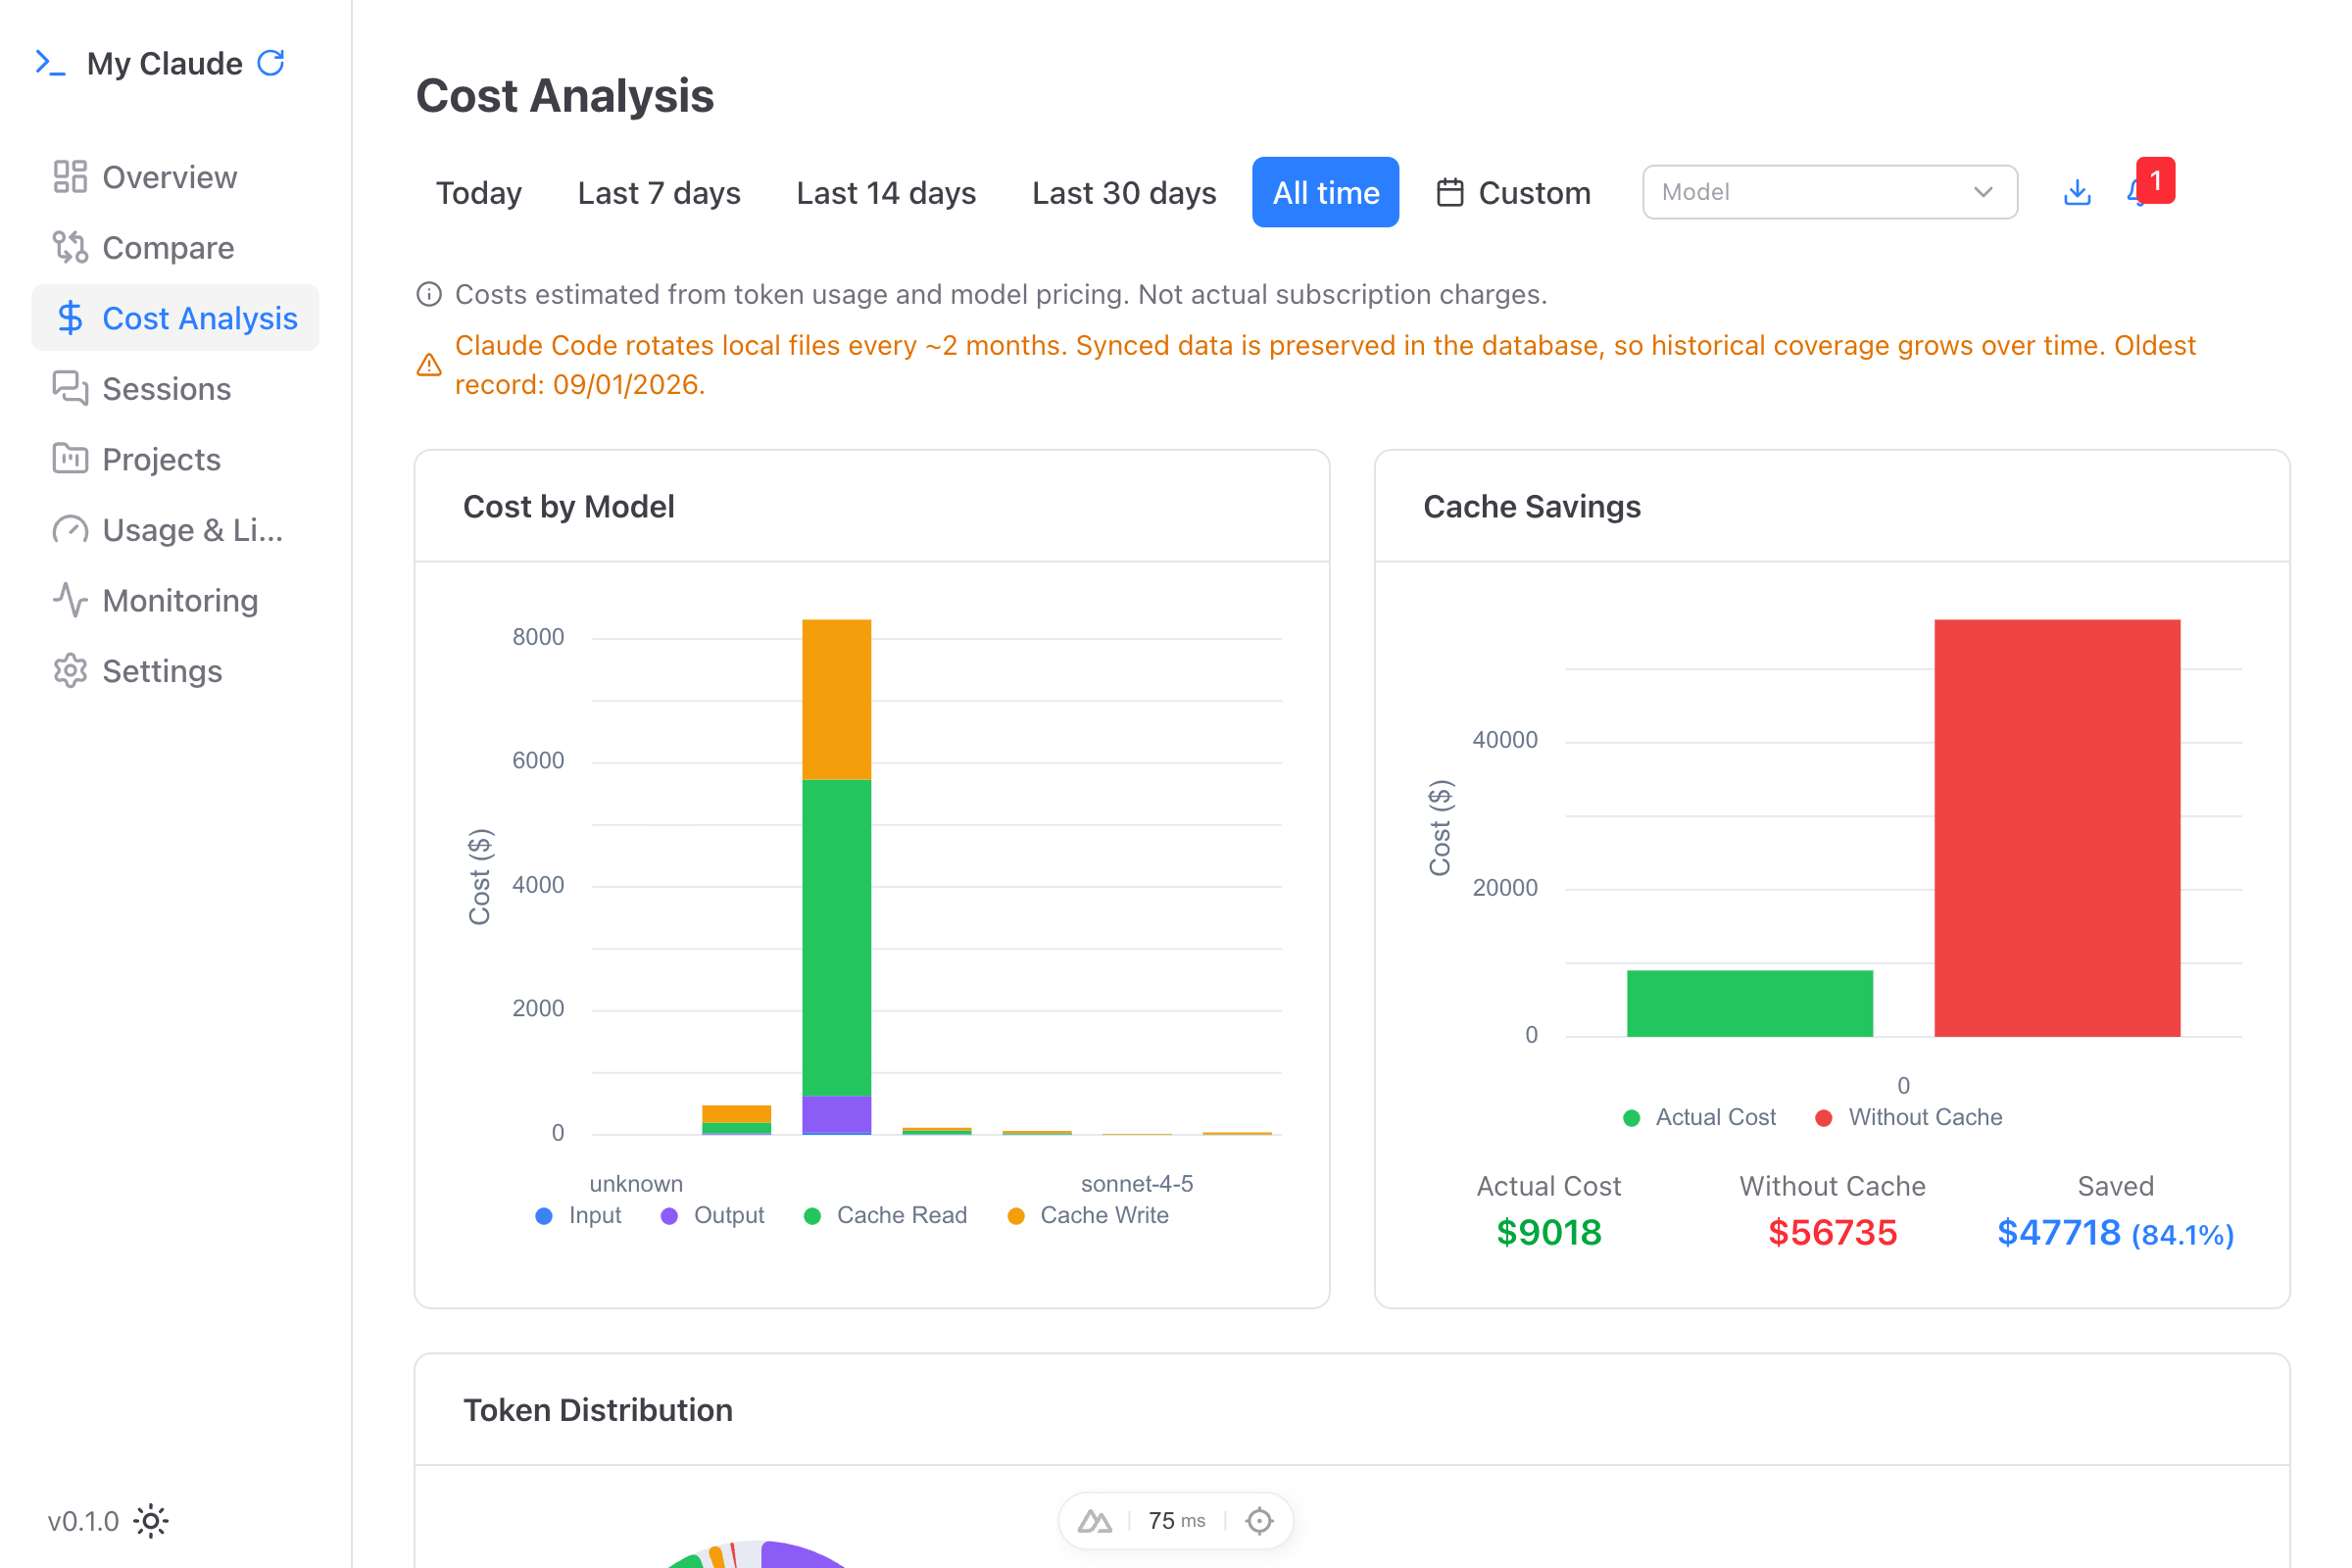
See exactly how much prompt caching is saving you:
- Actual cost vs what you would have paid without caching
- Total saved with percentage (e.g., "Saved $47.23 (42.3%)")
This alone can justify your plan choice and show the ROI of structuring your prompts for cache hits.
Context Window Breakdown
See exactly what's consuming your context window in the current session:
- System prompt allocation
- Memory/CLAUDE.md content
- Conversation history
- Free space remaining
- Autocompact buffer size
This is unique to My Claude - most tools don't show you which part of your prompt is eating tokens.
Per-Project Tracking
My Claude discovers your projects from session data and provides per-project breakdowns. Compare KPIs side-by-side across projects to see which codebases drive the most usage and cost.
Data Sources
Usage data comes from two sources:
- Local JSONL files - Session transcripts from Claude Code (immediate, real-time)
- Anthropic API - Billing data and rate limit status (authoritative for costs)
When API data is available, it takes precedence over local calculations. The data source is shown for each metric so you always know what you're looking at.
Data Storage
All usage snapshots are stored locally in a SQLite database on your machine. No data is sent to external servers. This local history powers the trend charts, heatmaps, and pace predictions.
Export
Every page with data has a CSV export button. Export your usage data for external analysis, reporting, or record-keeping. Exports respect your selected date range and filters.
Refresh Behavior
The dashboard refreshes automatically at regular intervals. You can also trigger a manual refresh from the sidebar or system tray. The refresh fetches the latest data from the Anthropic API.